Price Trends and Market Dynamics
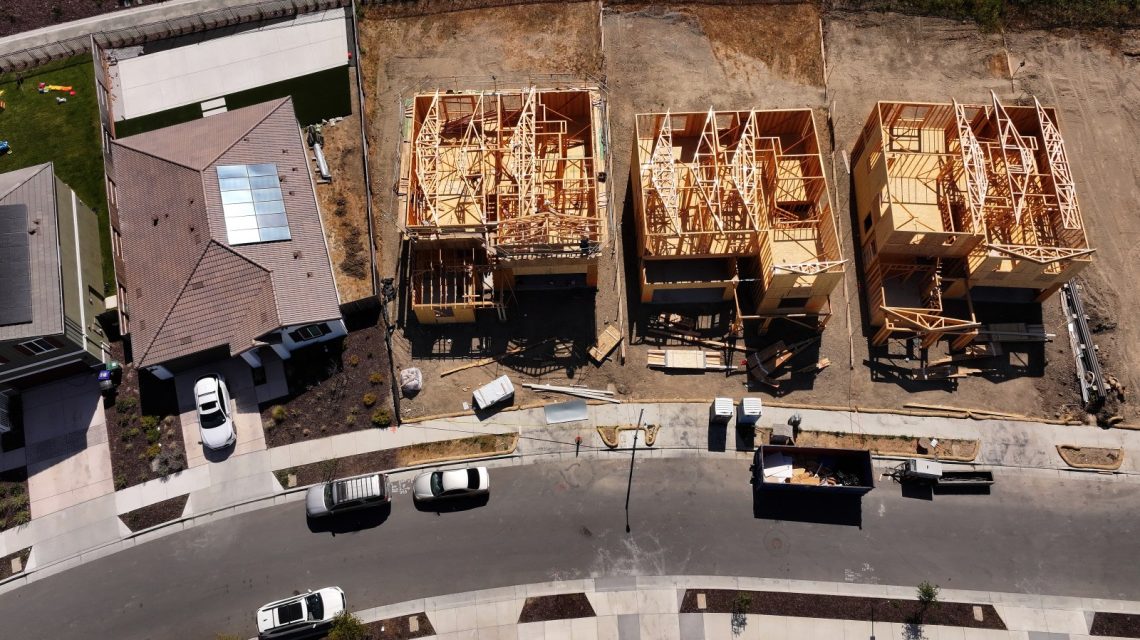
New home prices have reached their lowest level since the pandemic. Slow demand has prompted builders to offer sizable discounts to attract buyers. In the past month, the median sales price of a new home dropped to $393,800, marking a decrease of 2.3% from June’s $403,100, and a 0.9% decrease year-over-year from $397,300. This is the lowest price since July 2021, as reported by Realtor.com.
Since 2019, home prices have risen approximately 30% across the nation. This decline is favorable for buyers, especially when compared to existing homes, which typically form the bulk of listings. The median price for existing homes was $434,100 in July, surpassing new home prices. This shift is advantageous for buyers, as new homes usually do not require costly repairs.
Buyer Hesitation and Inventory Levels
Despite lower prices, new home sales are not increasing due to buyers’ reluctance and ample supply. Sales of new single-family homes decreased to a seasonally adjusted annual rate of 607,000 in July, down 10.5% from June and 6.3% from a year ago.
Inventory levels are also rising. The estimate of new homes for sale at the end of July stood at 488,000, an increase of 1.9% from June and 1.6% below July 2025 levels.
Affordability Challenges
The difficulties in affordability, including climbing home prices and mortgage rates, continue to affect both new and existing home sales. As of the week ending August 20, the national average for a 30-year fixed-rate mortgage was 6.65%, significantly higher than expectations earlier in the year for rates below 6%.
The median sale price for existing homes has continued to rise, reaching $434,100 in July, up from $425,700 in July 2025. Meanwhile, existing-home sales decreased 1.7% in July from June, with declines in the Midwest and South, stability in the West, and an increase in the Northeast.
Regional Differences in New Home Sales
New home sales exhibit notable regional variations similar to existing-home sales. In the Northeast, sales reached their highest level this year, up 30.3% from June and 95.5% from July 2025. However, in the South, sales decreased by 13% month-over-month and 5.2% year-over-year. The Midwest saw a drastic drop of 42.7% from June and 50.6% from July 2025, while the West experienced a rise of 6.2% from June and 2.2% from a year earlier.
Inventory fluctuations contribute to these regional disparities. The South encounters high inventory, where extensive development during the pandemic coincided with shrinking demand due to increased borrowing costs and return-to-office mandates. Conversely, the Northeast faces housing shortages and sustained demand.
Future Market Outlook
Continued uncertainty due to international conflicts, economic concerns like affordability constraints, and mortgage rates are expected to suppress demand and stabilize prices nationally, keeping growth between 1% and 3%.
The U.S. housing market’s regional divide is anticipated to persist. Some areas in the Northeast and Midwest may stay robust, while southern regions with high inventories, such as Florida and Texas, might experience slower growth or declines.
 Amazon Offers Discounts to Employees at Whole Foods
  Hidden Fees in Real Estate Transactions: A Growing Concern
  Trump’s Childhood Home Sells for Nearly $2 Million After Renovation
  Luxury Five-Bedroom Home with Rooftop Deck in Edgewater
  Trump’s Housing Affordability Agenda Faces Challenges
  Easing Mortgage Standards: A Complex Debate