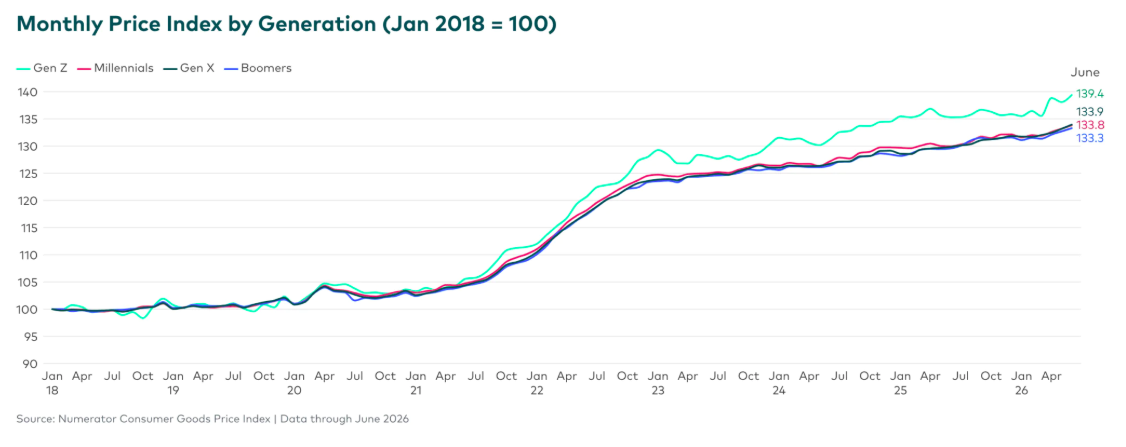
Generation Z Faces Higher Inflation Rates
Generation Z, individuals born between 1997 and 2012, are encountering inflation at levels higher than other generations. According to Numerator’s June 2026 Consumer Goods Price Index, prices for items they frequently purchase have surged by 39.4% since January 2018. In comparison, other generations have witnessed a national average increase of 33.8%.
Paul Stanley, Numerator’s senior economist, explained to Newsweek that Gen Z’s higher inflation rates stem from multiple factors, particularly because they tend to spend more on quick-service restaurants. Prices at these restaurants have risen by 54%, affecting both Gen Z and low-income consumers more than others.
Impacts on Low-Income Consumers
Stanley highlighted that low-income consumers are less able to adapt to rising costs. They significantly rely on value retailers and private label brands, limiting their capacity to make cost-effective choices.
Economics professor Hakan Yilmazkuday from Florida International University remarked that Numerator’s data accurately reflects the financial strain Gen Z faces. By using real household transaction data instead of modeled weights, the analysis reveals how younger consumers bear heavier inflation burdens.
Financial Stress Among Gen Z
These findings align with reports of Gen Z experiencing substantial stress over finances, influencing personal relationships. LendingTree research indicates that more people are resorting to personal loans for everyday expenses, highlighting a deepening affordability crisis.
Further adding to these challenges are escalating food prices, exacerbated by an intensifying El Niño in the Pacific Ocean. Forecasts from the World Meteorological Organization and NOAA predict continued price increases.
Consumer Preferences and Inflation Risks
Gen Z, currently aged 14 to 29, frequently enjoys dining out more than their older counterparts. Menumiz data shows 71% of Gen Z plan to increase their dining out rate through 2026. Additionally, they spend the most per dine-in meal and per takeout order, averaging $51 and $36 respectively.
The rising costs of dining, with menu prices increasing monthly by about 0.2%, leave Gen Z particularly susceptible to inflation.
Yilmazkuday also pointed out that Gen Z’s consumption habits in consumer categories like groceries and household goods make them vulnerable to severe price hikes.
Increasing Retail Costs
Numerator’s index indicated a rise in household item prices for the third month in a row. June saw a 0.70% increase, following similar rises in May and April. Compared to a year ago, June prices are up 3.4%.
Though lower gas prices offered slight relief, ongoing inflation continues to pressure low-income households. Numerator collects data from 200,000 U.S. households through its Receipt Hog app, which monitors purchases and price changes in categories like groceries and home goods.
The company employs a Fisher Price Index, closely aligning with official inflation indicators such as the PCE Food & Beverage measure, with a nearly perfect 0.93 correlation.