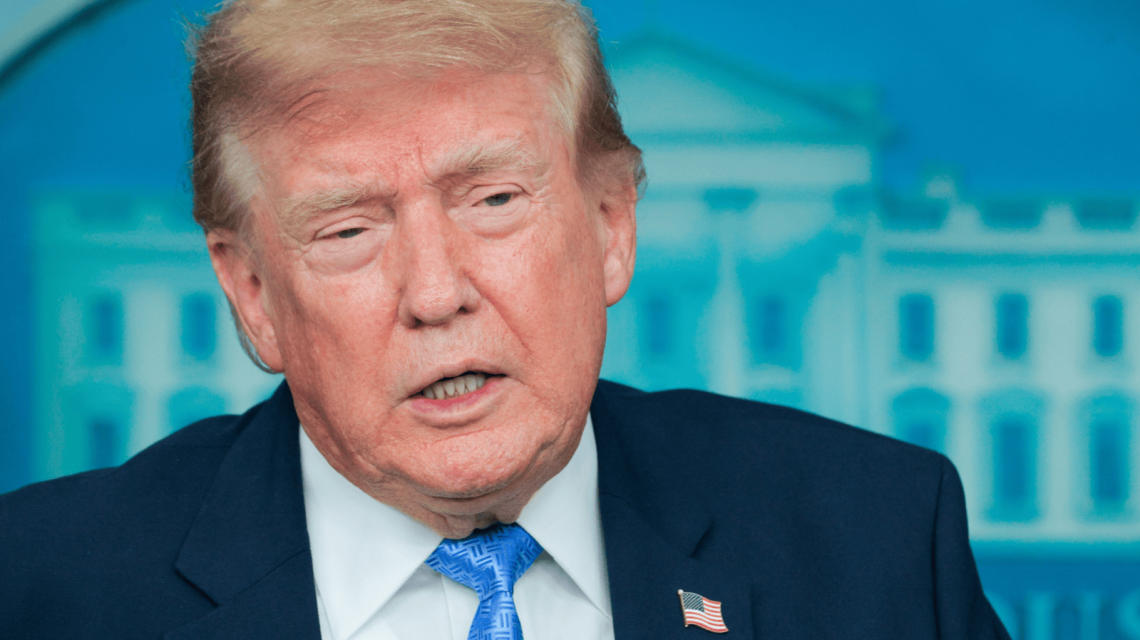
In recent polls from Echelon Insights, President Donald Trump’s approval ratings shifted starkly among low- and high-income voters. His net approval rose by 26 points among Americans earning under $30,000 between September and November, but fell 18 points among those earning at least $125,000. This occurred amid midterm elections that focused on economic issues. However, experts caution that small sample sizes might cause volatility in these results.
Costas Panagopoulos, a political science professor at Northeastern University, noted that shifts of this magnitude are unusual in public opinion. He warned that limited sample sizes in specific subgroups could result in statistical noise rather than actual preference changes. David Barker, a government professor at American University, found the pattern intriguing yet difficult to explain. He suggested that it might be random noise rather than a substantive shift.
“Shifts of this magnitude are rare in public opinion,” stated Panagopoulos. “These dramatic differences could be statistical noise rather than true, meaningful shifts in preferences.”
The White House defended Trump’s policies, including tax, border, health care, employment, and trade. Spokesperson Davis Ingle stated that Trump would remain dedicated to achieving results for the American people and predicted his presidency would be historically significant.
Different Movements Across Polls
The Echelon Insights survey in September revealed that 23% of respondents earning under $30,000 approved of Trump’s performance, while 75% disapproved, resulting in a net rating of minus 52. Among those with incomes of $125,000 or more, 41% approved and 58% disapproved, putting him at minus 17.
In October, approval in the lower-income bracket increased to 33%, with disapproval dropping to 65%, reducing the deficit to 32 points. Meanwhile, the wealthier group’s figures changed to an approval of 41% and disapproval of 57%, leaving Trump at minus 16. November showed the widest gap yet, with 36% approval and 62% disapproval among lower-income respondents, compared to 32% approval and 67% disapproval amongst the highest earners.
Panagopoulos pointed out that Trump remained underwater with both groups, as disapproval surpassed approval. The survey included 1,027 registered voters in November with a margin of error of plus or minus 3.7 points. Overall, 36% approved and 63% disapproved of Trump’s performance.
“If it’s a sample of a thousand people, now you’re talking about 150 or 200 people, and it’s probably even lower than that,” Panagopoulos explained regarding subgroup sample sizes.
Challenges with Surveying Income Subgroups
Thomas Gift, political science associate professor and director of the Centre on U.S. Politics at University College London, pointed out difficulties in surveying very high- and low-income populations. Their smaller sample sizes could lead to bias with large margins of error. If the trends continue in multiple surveys, there might be a genuine change in approval ratings.
However, Barker urged caution when comparing across three surveys, stating one should remain hesitant to draw hard conclusions. Panel data, interviewing the same respondents over time, provides a stronger test than comparing separate samples.
Possible Explanations for a Genuine Shift
If the results represent a true shift, Panagopoulos suggested that campaign efforts might have bolstered Trump’s support among lower-income voters. Higher-income individuals paying more attention as elections neared may have developed stronger negative views of Trump’s economic policies. Juven Jacob, a political strategist, speculated that Trump’s proposal for $5,000 checks could appeal to those facing financial challenges.
“The same squeeze that makes voters unhappy about prices can make a promise of direct relief more compelling,” Jacob remarked.
Thomas Gift cautioned against connecting poll figures to stock-market movements or varied economic experiences without explicit survey questions. Barker found it plausible that affluent respondents were influenced by market volatility.
Households Experience the Economy Differently
Jacob noted that economic perceptions differ across households. For one, the economy might be daily expenses; for another, it could include retirement savings. Changes in partisan composition and exposure to factors like fuel prices might also shape income subgroup reports.
James Christopher, a Democratic consultant, argued tangible household costs weigh more than market fluctuations politically, especially for low-income families striving to meet basic needs.
Future Surveys and Analysis
Additional surveys could substantiate these trends, especially if corroborated by competing pollsters. Jacob suggested observing approval and disapproval separately, as voters becoming more supportive carries a different implication than decreased hostility among critics. Barker proposed examining if the trend persists without campaign influence, supporting his theory of fortified partisan loyalties during electoral campaigns.
To assess true changes, researchers could use panel surveys that revisit the same respondents over time, distinguishing actual changes from month-to-month sample differences. Until then, these findings remain intriguing instead of definitive evidence.
 Amy Klobuchar Takes On Governorship with Promises for Minnesota’s Growth
 Challenges of Signature Requirements for Political Candidates in Illinois
 Debate Rekindled Over Gray Wolves and Livestock Losses
 White House Faces Backlash Over Controversial Video
 Former Press Secretary Critiques Republican Strategies
 Migration, Politics, Peace Talks, Health Alerts, Legal Settlements, and Fire Conviction News